


- August 11, 2026
- Posted by: Reza Kazemi
- Category: Forex Education

Let us start with an uncomfortable truth: what destroys most trading accounts is not faulty analysis — it is faulty position sizing. A trader risking 20% of their account per trade will reach a margin call sooner or later even with good analysis; the mathematics of the market is unforgiving and admits no exceptions. The reverse is equally true: a merely average trader who manages risk properly stays in the market for years and gets the chance to grow.
This article builds the financial backbone of trading: the 1–2% rule, where a stop loss actually belongs, risk-to-reward ratios, the exact position size formula with worked examples on EUR/USD and gold, and drawdown management.
Why Risk Management Matters More Than Analysis: The Mathematics of Loss
Many people assume that losing 30% means a 30% gain puts them back where they started. It does not — and that misunderstanding is the most expensive one in financial markets:
| Drawdown | Gain required to recover |
|---|---|
| 10% | 11% |
| 20% | 25% |
| 30% | 43% |
| 50% | 100% |
| 70% | 233% |
| 90% | 900% |
The message is clear: the deeper the fall, the harder recovery becomes — exponentially so. Someone who has lost half their account must double what remains simply to get back to level, which is something even professional traders struggle to do. The logical conclusion: a trader's first priority is not making money, it is not losing big. Every tool in this article exists for that purpose.
The 1–2% Rule: The Cornerstone of Money Management
The rule is simple: risk no more than 1 to 2 per cent of your total capital on any single trade. “Risk” means the amount you lose if your stop loss is hit — not the margin tied up in the trade, and not the value of the position.
The power of the rule shows in a comparison. Take two traders with $1,000 accounts, both of whom take ten consecutive losses — something that can happen with any strategy:
| Trader | Risk per trade | Balance after 10 consecutive losses | Situation |
|---|---|---|---|
| A — disciplined | 2% ($20) | About $817 | An 18% drawdown. Entirely recoverable |
| B — emotional | 15% | About $197 | An 80% drawdown. Recovery now requires a 400% gain |
Both had identical analysis. The only difference was position size. For beginners our recommendation is more conservative still: in your first months on a live account, work at 0.5 to 1 per cent risk, so that the cost of learning stays cheap.
Stop Losses: Where They Belong, and Where They Do Not
A stop loss is the insurance policy on every trade, and there is no debate about having one. The debate is about where to place it:
- Structural stop (the correct method): at the point where, if price reaches it, your analysis is formally invalidated — a few pips below the support you bought at, say, or below the signal candle's wick. The chart determines the stop, not your account balance.
- Fixed-dollar stop (the wrong method): “close it when I'm down $10”, regardless of price structure. The result is being stopped out repeatedly by ordinary market noise.
- An excessively tight stop (the second common error): a 5-pip stop on gold, whose normal movement is several times that, amounts to donating money to the market. A stop needs enough room that price “breathing” does not trigger it.
- Trailing stop: once a trade moves into profit, you can step the stop up behind price — behind successive higher lows, for instance — to lock in gains. Movement is only permitted in the direction of reducing risk. Moving a stop back to “give a losing trade room” is absolutely forbidden.
Risk-to-Reward: Why a 40% Win Rate Can Be Profitable
The risk-to-reward ratio (R/R) is the relationship between potential loss and potential gain on a trade. Risking 30 pips for a 60-pip target is a ratio of 1:2. Combined with win rate, that ratio determines your account's fate:
| R/R | 30% win rate | 40% win rate | 50% win rate |
|---|---|---|---|
| 1:1 | Losing | Losing | Break-even |
| 1:2 | Roughly break-even | Profitable | Profitable |
| 1:3 | Profitable | Strongly profitable | Strongly profitable |
That table is liberating: you do not need to be right most of the time. You need your winners to be systematically larger than your losers. The practical rule: if a setup does not offer at least 1:1.5, do not take it. Sometimes the best trades are the ones you do not make.
The Position Size Formula: The Heart of This Article
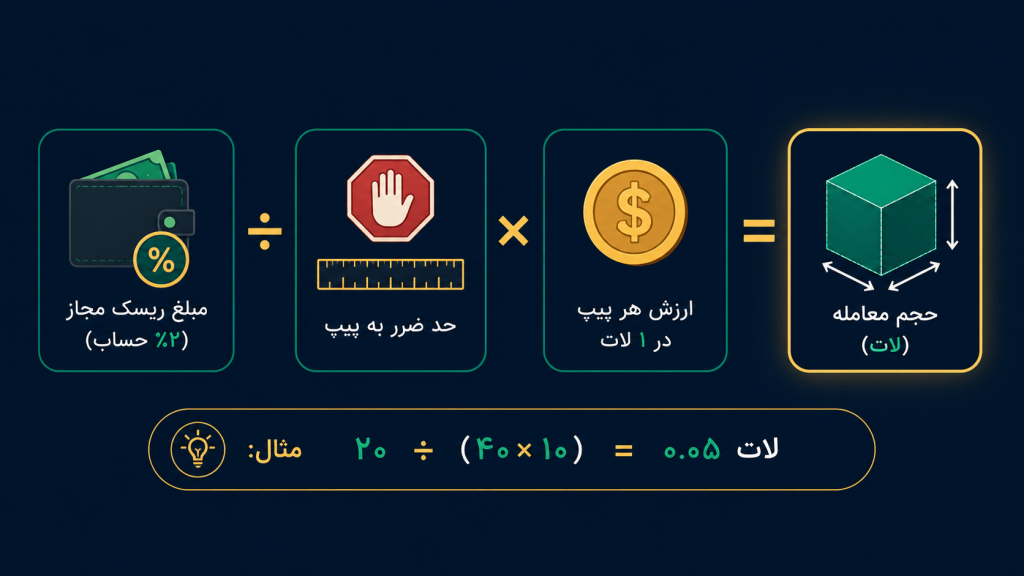
Now the most important practical skill: converting “2% risk” into an exact lot figure. The formula:
Position size (lots) = permitted risk ÷ (stop loss in pips × pip value at one lot)
To use it, you need to know the pip value of the main instruments:
| Instrument | Value at 1 standard lot | At 0.1 lots | At 0.01 lots |
|---|---|---|---|
| EUR/USD and most dollar pairs — per pip | $10 | $1 | $0.10 |
| Gold (XAU/USD) — per $1 of price movement | $100 | $10 | $1 |
The definition of a “pip” in gold varies between brokers. The simplest thing to know is that at 1 standard lot, every $1 of movement in the gold price is $100 of profit or loss. Check the exact figure in the instrument's specification in MetaTrader.
Example 1: EUR/USD
- Account: $1,000 | Permitted risk: 2% = $20
- Setup: a buy with a 40-pip stop loss
- Calculation: 20 ÷ (40 × 10) = 0.05 lots
Example 2: Gold
- Account: $500 | Permitted risk: 1% = $5
- Setup: a sell with a $5 stop loss on the gold price
- Calculation: 5 ÷ (5 × 100) = 0.01 lots
Note the order of operations: analysis and stop placement first, position size second. Beginners do it backwards — they enter their preferred size first, then tighten the stop until “the risk is smaller”, and the result is a run of stop-outs.
If the calculated size comes out below your broker's minimum of 0.01 lots, that trade is too large for your current account size: either skip it, or move to a cent account.
Drawdown: Managing the Bad Days
Drawdown is the distance between your current balance and the account's historical peak. Every strategy has losing periods; what separates the professional from the beginner is the response to them:
- A daily loss limit: if you take three consecutive losses in one day, or the account falls 4 to 5 per cent, close the platform and walk away. The market will be there tomorrow; a destroyed account will not. Prop firms control their traders with exactly this rule.
- Reduce size during drawdown: when the account is down, halve your risk per trade — from 2% to 1%, say — to stop the hole getting deeper. Return to normal size only after the account is climbing again.
- No revenge trading: the largest losses in the history of retail accounts have been recorded immediately after an ordinary loss, when the trader set out to “take their money back from the market”. After every stop-out, step away from the chart for at least fifteen minutes.
Leverage: A Managed Ally, an Unmanaged Enemy
Leverage does not “multiply” your profit and loss — position size does that. Leverage merely permits you to open a larger position. A trader who sizes positions with the formula in this article carries the same 2% risk even at 1:2000 leverage; a trader without a formula will burn an account at 1:50. The real danger is the temptation high leverage creates: “now that I can trade 1 lot, why wouldn't I?” The answer: because your formula said 0.05.
The Trading Journal: A Mirror That Does Not Lie
For every trade, record at least these eight items — a simple spreadsheet is enough: date and instrument, direction, reason for entry (which setup?), size and risk percentage, initial stop and target, result in R (a +2 means you made twice your risk), a chart screenshot, and one sentence about your state of mind.
After every 20 to 50 trades, run the numbers: win rate, average R, most frequent mistake. That report is worth more than any paid course, because it is about you.
Risk Management Plan Checklist (Ready to Use)
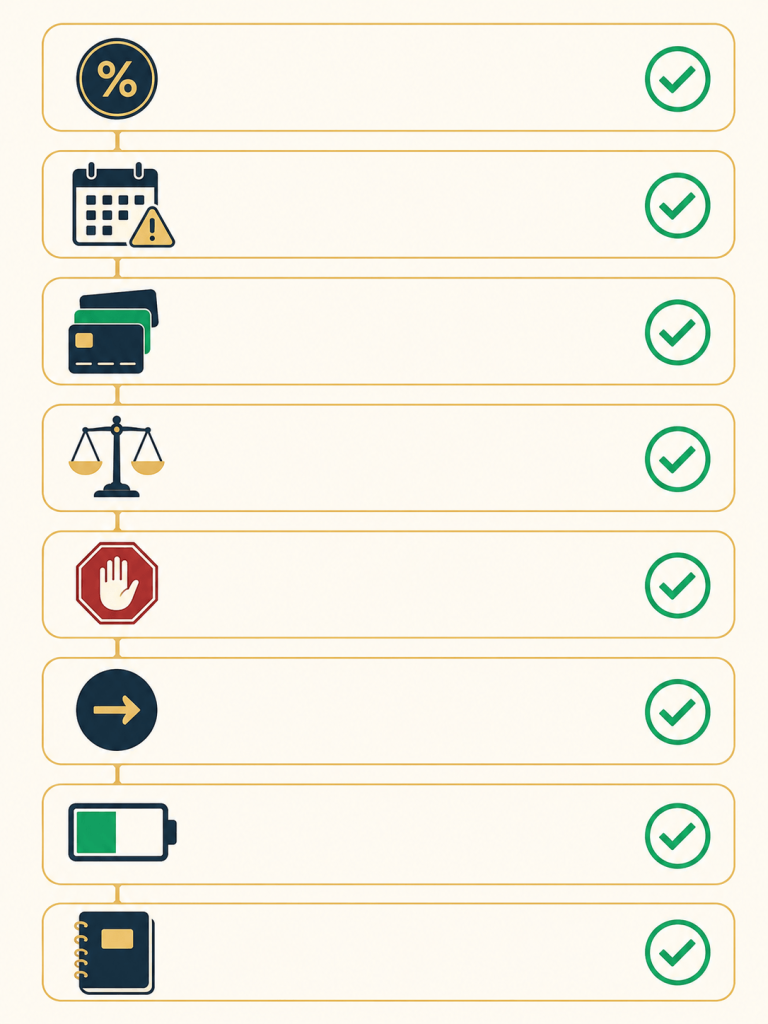
- Risk per trade: maximum __% (suggested: 1–2; beginners: 0.5–1)
- Maximum daily loss: __% or __ consecutive losing trades (suggested: 4% or 3 trades)
- Maximum simultaneous open positions: __ (suggested: 2–3, preferably not correlated through one currency)
- Minimum risk-to-reward to enter: 1:__ (suggested: 1.5)
- Stop loss: on every trade, without exception, determined by chart structure
- Moving a stop: only in the direction of reducing risk
- At drawdown above __%: risk is halved (suggested: 10)
- Journal entries: for 100% of trades, without exception
Fill this in, print it and stick it beside your monitor. A rule that has not been written down does not exist in the heat of the moment.
Frequently Asked Questions
Does the 2% rule make sense on small accounts?
Yes, and it is even more critical there. On a $100 account, 2% means $2 of risk per trade, which is entirely workable with a cent account or 0.01 lots. If those numbers seem “small and pointless”, the problem is not the rule — it is an unrealistic expectation about how fast an account should grow.
Is a mental stop loss enough? Why must it be placed in the platform?
No, it is not enough. Under pressure a mental stop almost always becomes “let's wait one more candle”. On top of that, during fast news moves or an internet outage you have no protection whatsoever. A real stop loss is an order recorded in MetaTrader.
Does martingale — doubling size after a loss — work?
Martingale is the mathematics of bankruptcy. A handful of consecutive losses, which are unavoidable in any strategy, escalate position size to the point where one stop-out takes the whole account. Every system or robot built on martingale arrives at that point eventually, regardless of its record up to then.
Is a higher risk-to-reward always better?
Not necessarily. Very high ratios — 1:5, for example — push win rates sharply down and make consecutive losses psychologically hard to tolerate. For most trend-following strategies, the 1:1.5 to 1:3 range is a good balance. Your journal will tell you the exact figure.
What proportion of my assets should go into forex?
The general investing principle is that only the portion of your assets whose loss would not damage your life should go into high-risk markets. For most people that means a small percentage of savings — and certainly not borrowed money, a loan, or funds needed for essential living costs. This is a personal decision that depends on your own financial situation.
Conclusion
Risk management is not exciting. It is tables, formulas and discipline. But that tedious part is precisely the line between those who are still in the market six months later and those who left with a bitter memory. The practical summary in one line: the chart determines where the stop goes, then the formula says how many lots — and no trade exists outside that order.
Write your plan today from the checklist and execute ten trades on a demo account with the size properly calculated. After that, move on to the next link in the chain — trading psychology — because the best plan in the world is just a text file without disciplined execution.