


- August 11, 2026
- Posted by: Reza Kazemi
- Category: Forex Education

Technical analysis is the common language of traders everywhere — from the retail trader in Tehran watching charts on a phone to the dealing desks of major banks. Learn that language, and a chart stops being a mess of lines and coloured candles and becomes a readable account of the fight between buyers and sellers.
This guide builds technical analysis from the ground up, in the order that actually makes sense: candles first, then support and resistance, then trend, patterns and indicators. At the end we put all of it together and construct a real trading setup. To practise each section, open a chart in MetaTrader or TradingView — a free demo account is enough to get started.
What Is Technical Analysis, and Why Does It Work?
Technical analysis means studying past price behaviour to estimate probable future movement. Where fundamental analysis asks “what is this asset actually worth?”, technical analysis asks “what are buyers and sellers doing right now, and what are they likely to do next?” The approach rests on three assumptions laid down by Charles Dow, the father of modern technical analysis, more than a century ago:
- Price discounts everything: every piece of news, every statistic, every expectation eventually shows up in the price. Studying price therefore means studying the sum of all available information.
- Price moves in trends: market movement is not purely random. Trends form, and until they show signs of reversing, continuation remains the more likely outcome.
- History repeats itself: because human psychology — fear and greed — does not change, behavioural patterns in price recur again and again.
One honest point that most courses skip: technical analysis is not prediction, it is probability. No pattern and no indicator works every time. The trader's craft is finding situations with better-than-even odds and then letting risk management turn a series of trades into a positive result.
Types of Price Chart
| Chart type | What it shows | Who it suits |
|---|---|---|
| Line | Closing price only, for each period | A quick overall view of where price has been |
| Bar | All four prices: open, close, high, low | Older-school traders; rarely used today |
| Japanese candlestick | The same four prices, but showing buyer and seller strength visually | The practical standard for every trader — and the focus of this guide |
Candlesticks: The Alphabet of Technical Analysis
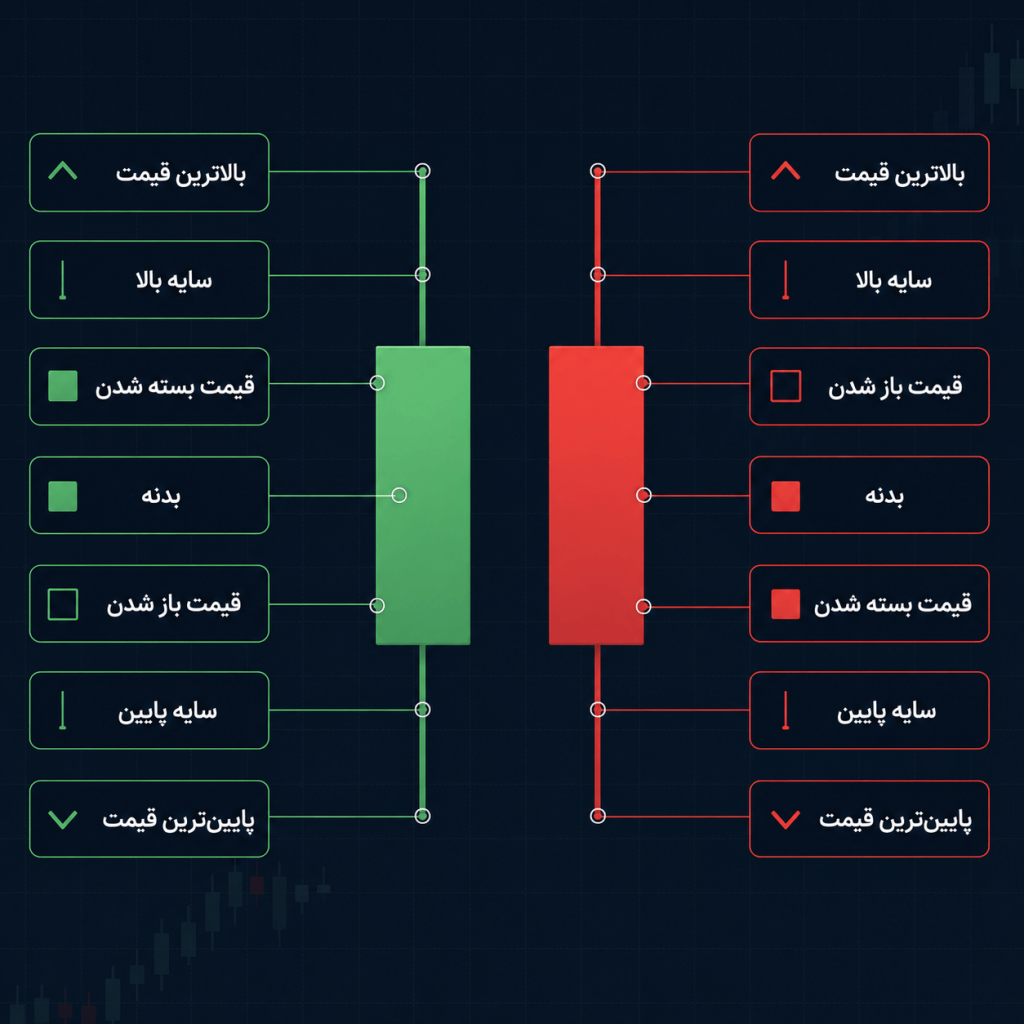
Each candle summarises the battle between buyers and sellers over one period. Its parts:
- Body: the distance between the open and the close. A long body means one side won decisively; a short body means balance and hesitation.
- Wicks (shadows): the thin lines above and below the body, marking the high and low of the period. A long wick means price travelled that far and was rejected — and that rejection carries a great deal of information.
- Colour: a bullish candle (usually green) closed above where it opened; a bearish candle (red) did the opposite.
Candlestick Patterns Worth Knowing
| Pattern | What it looks like | What the market is saying |
|---|---|---|
| Pin bar | Small body with one long wick | Decisive rejection from a level — a strong reversal signal at support or resistance |
| Engulfing | A candle whose body fully covers the previous one | An abrupt shift of control to buyers (bullish engulfing) or sellers (bearish) |
| Doji | Body close to zero — open and close nearly identical | Complete indecision. At an important level it can precede a reversal |
| Harami | A small candle contained inside the previous large body | Momentum from the prior move is fading; wait for the next candle to confirm |
| Morning / evening star | A three-candle formation at a low or a high | The classic reversal pattern at the end of a trend |
The single most important rule of reading candles: a candlestick pattern on its own is not a signal — where it forms is what gives it meaning. A pin bar in the middle of a directionless range is close to worthless. The same pin bar at a valid support level, in the direction of the trend, is a serious trading opportunity. Commit that sentence to memory, because this entire guide revolves around it.
Support and Resistance: The Most Important Concept in Technical Analysis
Support is an area where, historically, every time price arrived, buyers stepped in and pushed it back up. Resistance is the mirror image — an area where sellers have capped advances. These levels work because thousands of traders, and a great many algorithms, are looking at the same places and clustering their orders around them: a self-fulfilling prophecy of sorts.
How to Draw Levels Properly
- Treat levels as zones, not surgically precise lines. Price typically reacts a few pips above or below.
- A level is more credible when it has more touches, sharper reactions, and is visible on a higher timeframe.
- Round numbers — 2000 in gold, 1.1000 in EUR/USD — carry psychological weight because orders accumulate there.
- Role reversal: when resistance breaks convincingly, it usually becomes support on the retest, and vice versa. This “pullback to a broken level” is one of the most frequently traded setups in the world.
Trend: Your Friend, For As Long As It Lasts
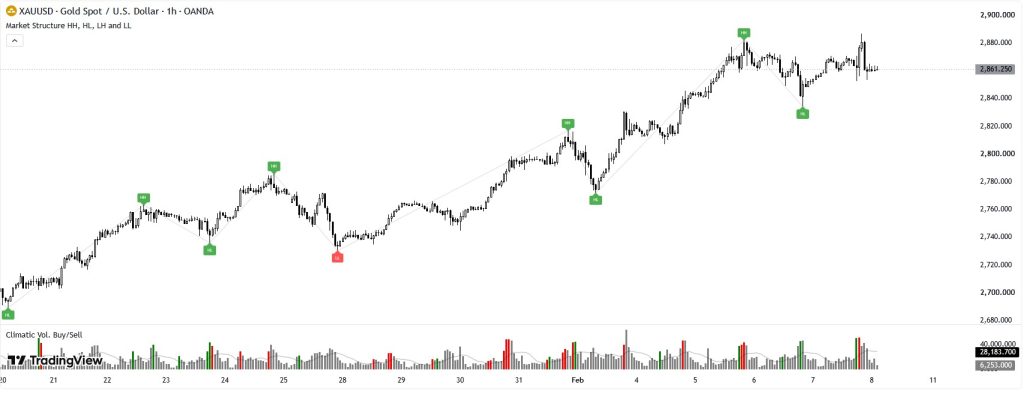
The market has only three states: uptrend, downtrend and range. Define them by price structure, not by how the chart feels:
- Uptrend: a sequence of higher highs (HH) and higher lows (HL). While that structure holds, buy trades take priority.
- Downtrend: a sequence of lower highs (LH) and lower lows (LL). Sell trades take priority.
- Range: price oscillates between support and resistance. Either trade both edges of the range, or wait until the breakout resolves the question.
A trendline is drawn by connecting at least two lows in an uptrend, or two highs in a downtrend. It is the third touch onward that makes the line credible and tradable. A trendline break on its own means the move is slowing, not necessarily reversing — for a genuine reversal, wait for a break in structure, such as a lower low forming during an uptrend.
Classic Chart Patterns
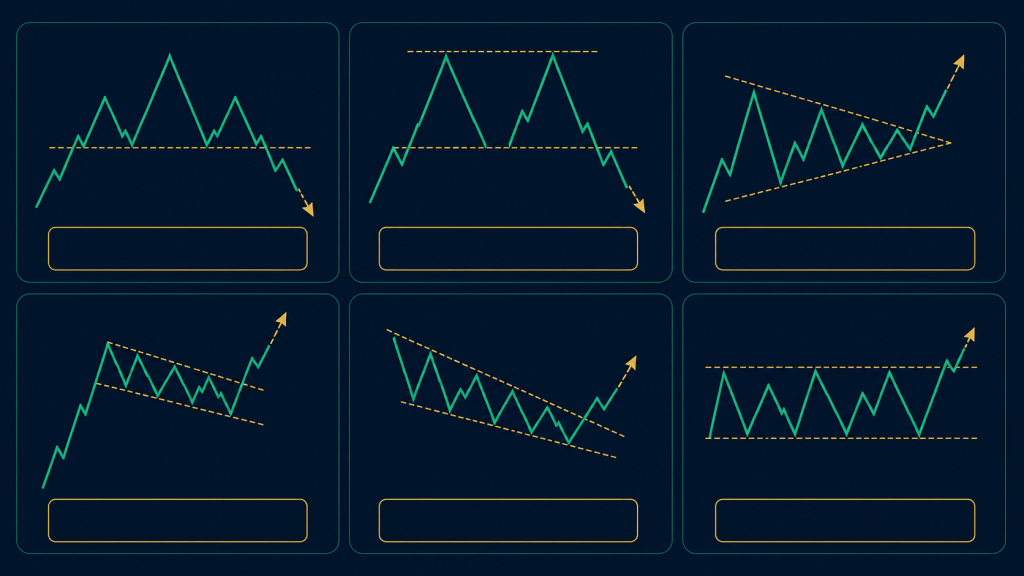
Classic patterns are recurring structures that often give away the end or the continuation of a trend earlier than anything else:
| Pattern | Type | What it means and how it is traded |
|---|---|---|
| Head and shoulders | Reversal | Three peaks with the middle one highest. A break of the neckline signals the end of the uptrend |
| Double top / bottom | Reversal | Two failed attempts at the same level. A break of the intervening low or high confirms the reversal |
| Symmetrical triangle | Continuation | Compressing volatility. Trade in the direction of the breakout |
| Flag | Continuation | A brief pause after a sharp move. Trade the break in the direction of the prior trend |
| Wedge | Reversal or continuation | Two converging lines sloping the same way. Usually breaks against the slope |
| Rectangle (range) | Continuation | A range between two parallel levels. Trade both edges, or the breakout |
Two golden rules for patterns. First, a pattern is not tradable until it is complete — meaning a valid break has occurred. Half the losses beginners take come from trading unfinished patterns. Second, the pattern's price target is usually estimated as the height of the pattern itself, projected from the breakout point. That gives you a rational take profit rather than a hopeful one.
Indicators: A Support Tool, Not a Magic Wand
An indicator is nothing more than a mathematical calculation performed on the same price data. No indicator contains information “beyond price” — it simply shows price from a different angle. Five widely used tools:
| Indicator | Common setting | Correct use | Common mistake |
|---|---|---|---|
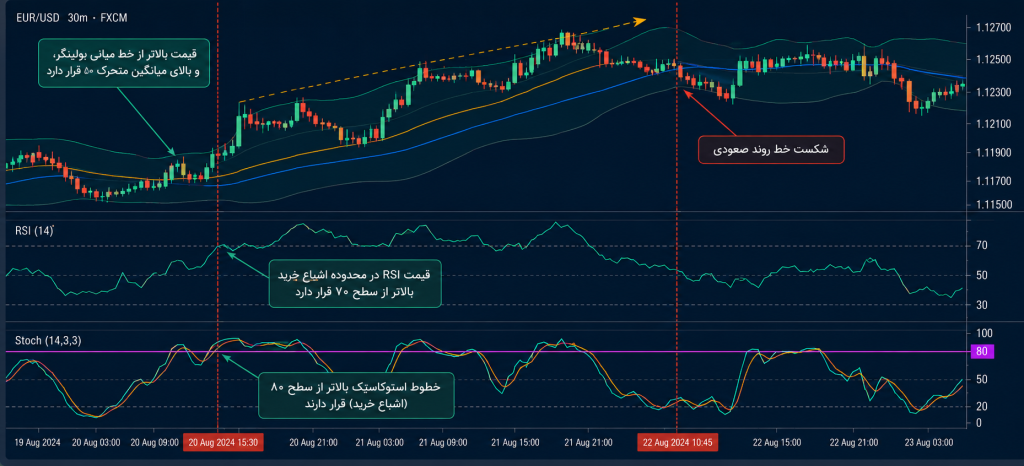
| Moving average (EMA) | EMA 20 and EMA 50 | Reading trend direction and dynamic support/resistance | Trading every crossover in a ranging market — a stream of false signals |
| RSI | Period 14 | Gauging momentum and finding divergences at important levels | Selling simply because RSI is above 70. In a strong trend, overbought conditions can persist for a long time |
| MACD | 12, 26, 9 | Confirming momentum shifts and divergences | Using it as a standalone entry signal, with no regard for price structure |
| Bollinger Bands | Period 20, deviation 2 | Measuring volatility and spotting compression before a large move | Assuming a touch of the band guarantees a reversal |
| Fibonacci retracement | Levels 38.2, 50, 61.8 | Locating the likely end of a pullback within a trend | Drawing from arbitrary points. Fibonacci must be anchored to a valid swing high and low |
A simple rule: one or two indicators at most, and only in the role of filter and confirmation, never as the primary decision-maker. The backbone of your analysis should be price structure — trend plus levels. Indicators are calculated on past data and always lag slightly; a trader who fails to grasp that will chronically enter late.
Timeframes and Multi-Timeframe Analysis
A classic beginner error: analysing and trading exclusively on one low timeframe — five minutes, say — and drowning in noise. The professional approach works in three layers:
- Higher timeframe (D1 or H4): establish overall trend direction and the major levels. This is the map.
- Middle timeframe (H4 or H1): locate the entry area and the structure of the current swing.
- Lower timeframe (M15 / M5): used only to refine the entry point and tighten the stop loss.
The rule: the higher timeframe decides direction, the lower timeframe decides entry. To begin with, a D1/H4/H1 combination is far less stressful. Steer clear of scalping one-minute charts — it is difficult even for experienced traders.
Price Action and Modern Styles: Smart Money and ICT
Price action means trading on pure price behaviour — candles, levels and structure — without relying on indicators. Everything covered so far is, in fact, the foundation of classical price action. In recent years more modern approaches such as Smart Money Concepts (SMC) and ICT have become extremely popular among Iranian traders. These styles work with ideas like liquidity, order blocks and stop hunts, attempting to follow the footprints of bank and institutional money.
Our honest advice: these approaches are worth learning, but without command of the fundamentals in this article, studying them is like building a second floor with no first floor. Spend three months trading trend, levels and candles methodically on demo. After that, if you still want to, move to SMC — it will make far more sense, far faster.
Building Your First Trading Setup: All the Pieces Together
Now let us assemble what you have learned into a simple but complete system — what traders call a setup. Here is a classic trend-following example:
- Condition 1 — direction: the H4 chart is in an uptrend (higher highs and higher lows).
- Condition 2 — location: price pulls back to a valid support level, or to broken resistance that has flipped role.
- Condition 3 — signal: at that level on H1, a confirming candlestick pattern forms — a pin bar or bullish engulfing.
- Entry: after the signal candle closes.
- Stop loss: a few pips below the signal candle's wick, or below the support level.
- Take profit: the next resistance, provided the risk-to-reward ratio is at least 1:2. If it is not, skip the trade.
- Position size: according to the 1–2% risk rule.
Those few lines are a genuine trading plan. Write them down, execute the setup fifty times on a demo account, and record the results in a journal. After fifty trades your own statistics — win rate, average R/R, largest drawdown — will tell you where the system is weak. This route is duller than following a Telegram signal channel. It is also the only one that turns you into a trader.
Common Mistakes in Technical Analysis
- Cluttering the chart: five indicators stacked on top of each other is not analysis, it is analytical paralysis. A clean chart means a clear head.
- Seeing patterns everywhere: the human mind is built to find patterns, including where none exist. Trade only obvious patterns at important levels. If you have to stare at the chart for ten seconds to “find” the pattern, there isn't one.
- Fighting the trend: hunting tops and bottoms is tempting, and expensive. Let the reversal prove itself in the structure first.
- Re-analysing after entry: analysis happens before the trade. After entry, you execute the plan. Finding “new reasons” to hold a losing position is not analysis, it is rationalisation.
- Ignoring the news: the best technical setup in the world can be destroyed by a single candle minutes before a US rate decision. Always check the economic calendar.
A 30-Day Practice Plan
| Week | Focus | Daily exercise (30–60 minutes) |
|---|---|---|
| Week 1 | Reading candles | On the H4 charts of gold and EUR/USD, find 10 significant candles a day and note what each is saying |
| Week 2 | Levels and trend | For 3 instruments, draw the major levels and mark the trend structure (HH/HL or LH/LL) |
| Week 3 | Combining | Find 2 setups a day that meet “trend + level + confirming candle”. Identification only, no trading |
| Week 4 | Demo execution | Execute those setups at 0.01 lots with a stop loss on a demo account, and log every one in your journal |
Frequently Asked Questions
How long does it take to learn technical analysis?
The concepts in this article can be absorbed in a few weeks, but converting that knowledge into a dependable skill usually takes six to twelve months of consistent practice and journalling. Your speed depends on the quality of your practice, not the number of courses you buy.
Technical or fundamental analysis — which is better?
They are not rivals, they are complements. Technical analysis tells you where and when; fundamental analysis tells you why. Most retail traders take entries and exits technically and use the economic calendar to stay out of high-risk moments.
What is the best indicator for a beginner?
If forced to choose: one moving average (EMA 20 or 50) to read direction, and RSI to gauge momentum. But we would stress again that no indicator replaces price structure — trend and levels.
On which timeframe is technical analysis more reliable?
The higher the timeframe, the less noise and the more dependable the signals. That is why beginners are advised to start their analysis on D1 and H4, and to keep away from anything below 15 minutes.
Does technical analysis work on gold and crypto too?
Yes. The principles of candles, levels, trend and patterns behave the same way in any liquid market — gold, currency pairs, indices and crypto alike. What differs is each market's character: how volatile it is and when it is most active. That part you learn by watching it.
Conclusion: Your Map From Here
Technical analysis means reading the story of buyers and sellers off a chart: candles are the words, levels are the battleground, and trend is the direction of the narrative. Go back over the working formula from this article — trend + level + candlestick confirmation + risk management. Those four pieces will serve you better than most of the elaborate systems being sold online.
Next step: open a demo account, start the 30-day plan above, and once you are comfortable with the technical side, move on to fundamental analysis and the economic calendar to complete the picture.